Table of Contents 🔗
- Reversal Indicator Introduction
- 1. Reversal Indicator Installation
- 2. Setting Up the Reversal Indicator
- 3. Understanding Indicator Key Principles
- 4. Indicator Parameters & Configuration
- 5. Problem Solving
- 6. Additional Insights
- 7. General Questions (FAQ)
Reversal Indicator Introduction 🔗
The Reversal Indicator is a valuable tool for traders, offering precise entry signals based on price corrections and reversal levels. This step-by-step guide will walk you through the process of installing, setting up, and effectively using the Reversal Indicator to enhance your trading strategy.
1. Reversal Indicator Installation 🔗
- Download Indicator: Download the Reversal Indicator file. Save it in a location that is easily accessible.
- Import the Indicator: Open the NinjaTrader Control Center and navigate to
Tools > Import > NinjaScript Add-On.... Choose the downloaded Reversal Indicator file and click “Import” to add it to NinjaTrader. - Confirm Import Messages: During the import process, you may receive confirmation messages. Click “Confirm” for each message to replace existing templates or files related to the strategy with the new ones.
- Restart NinjaTrader: After successful import, restart NinjaTrader to ensure you’re using the latest version of the Reversal Indicator.
2. Setting Up the Reversal Indicator 🔗
- Open a chart in NinjaTrader where you want to use the Reversal Indicator.
- Right-click on the chart and select
Indicators... - In the Indicators window, locate and select
Reversal Indicatorfrom the list. - Adjust the settings such as risk/reward ratio according to your trading preferences.
Finally, click OK to apply the indicator to your chart.
3. Understanding Indicator Key Principles 🔗
The Reversal Indicator generates entry signals based on price corrections and reversal levels, enabling traders to identify potential market turning points. It offers precise entry points with the potential for substantial movement at minimal risk.
3.1 Key Principles 🔗
- Risk/Reward Settings: Maintain a
Risk/Reward ratio of 1:1for optimal outcomes. - Signal Reliability: Signals hold a probability of reaching the 1:1 risk/reward ratio target within the range of 70-90%.
- Sequential Signals: It is always better to wait for the completion of the previous signal before considering a new one.
- Maximizing Targets: Target from a signal can be significantly larger, leaving a runner on the table is advisable.
3.2 Strategic Entry Approach 🔗
- Wait for a valid signal to appear on the chart indicating a potential price reversal.
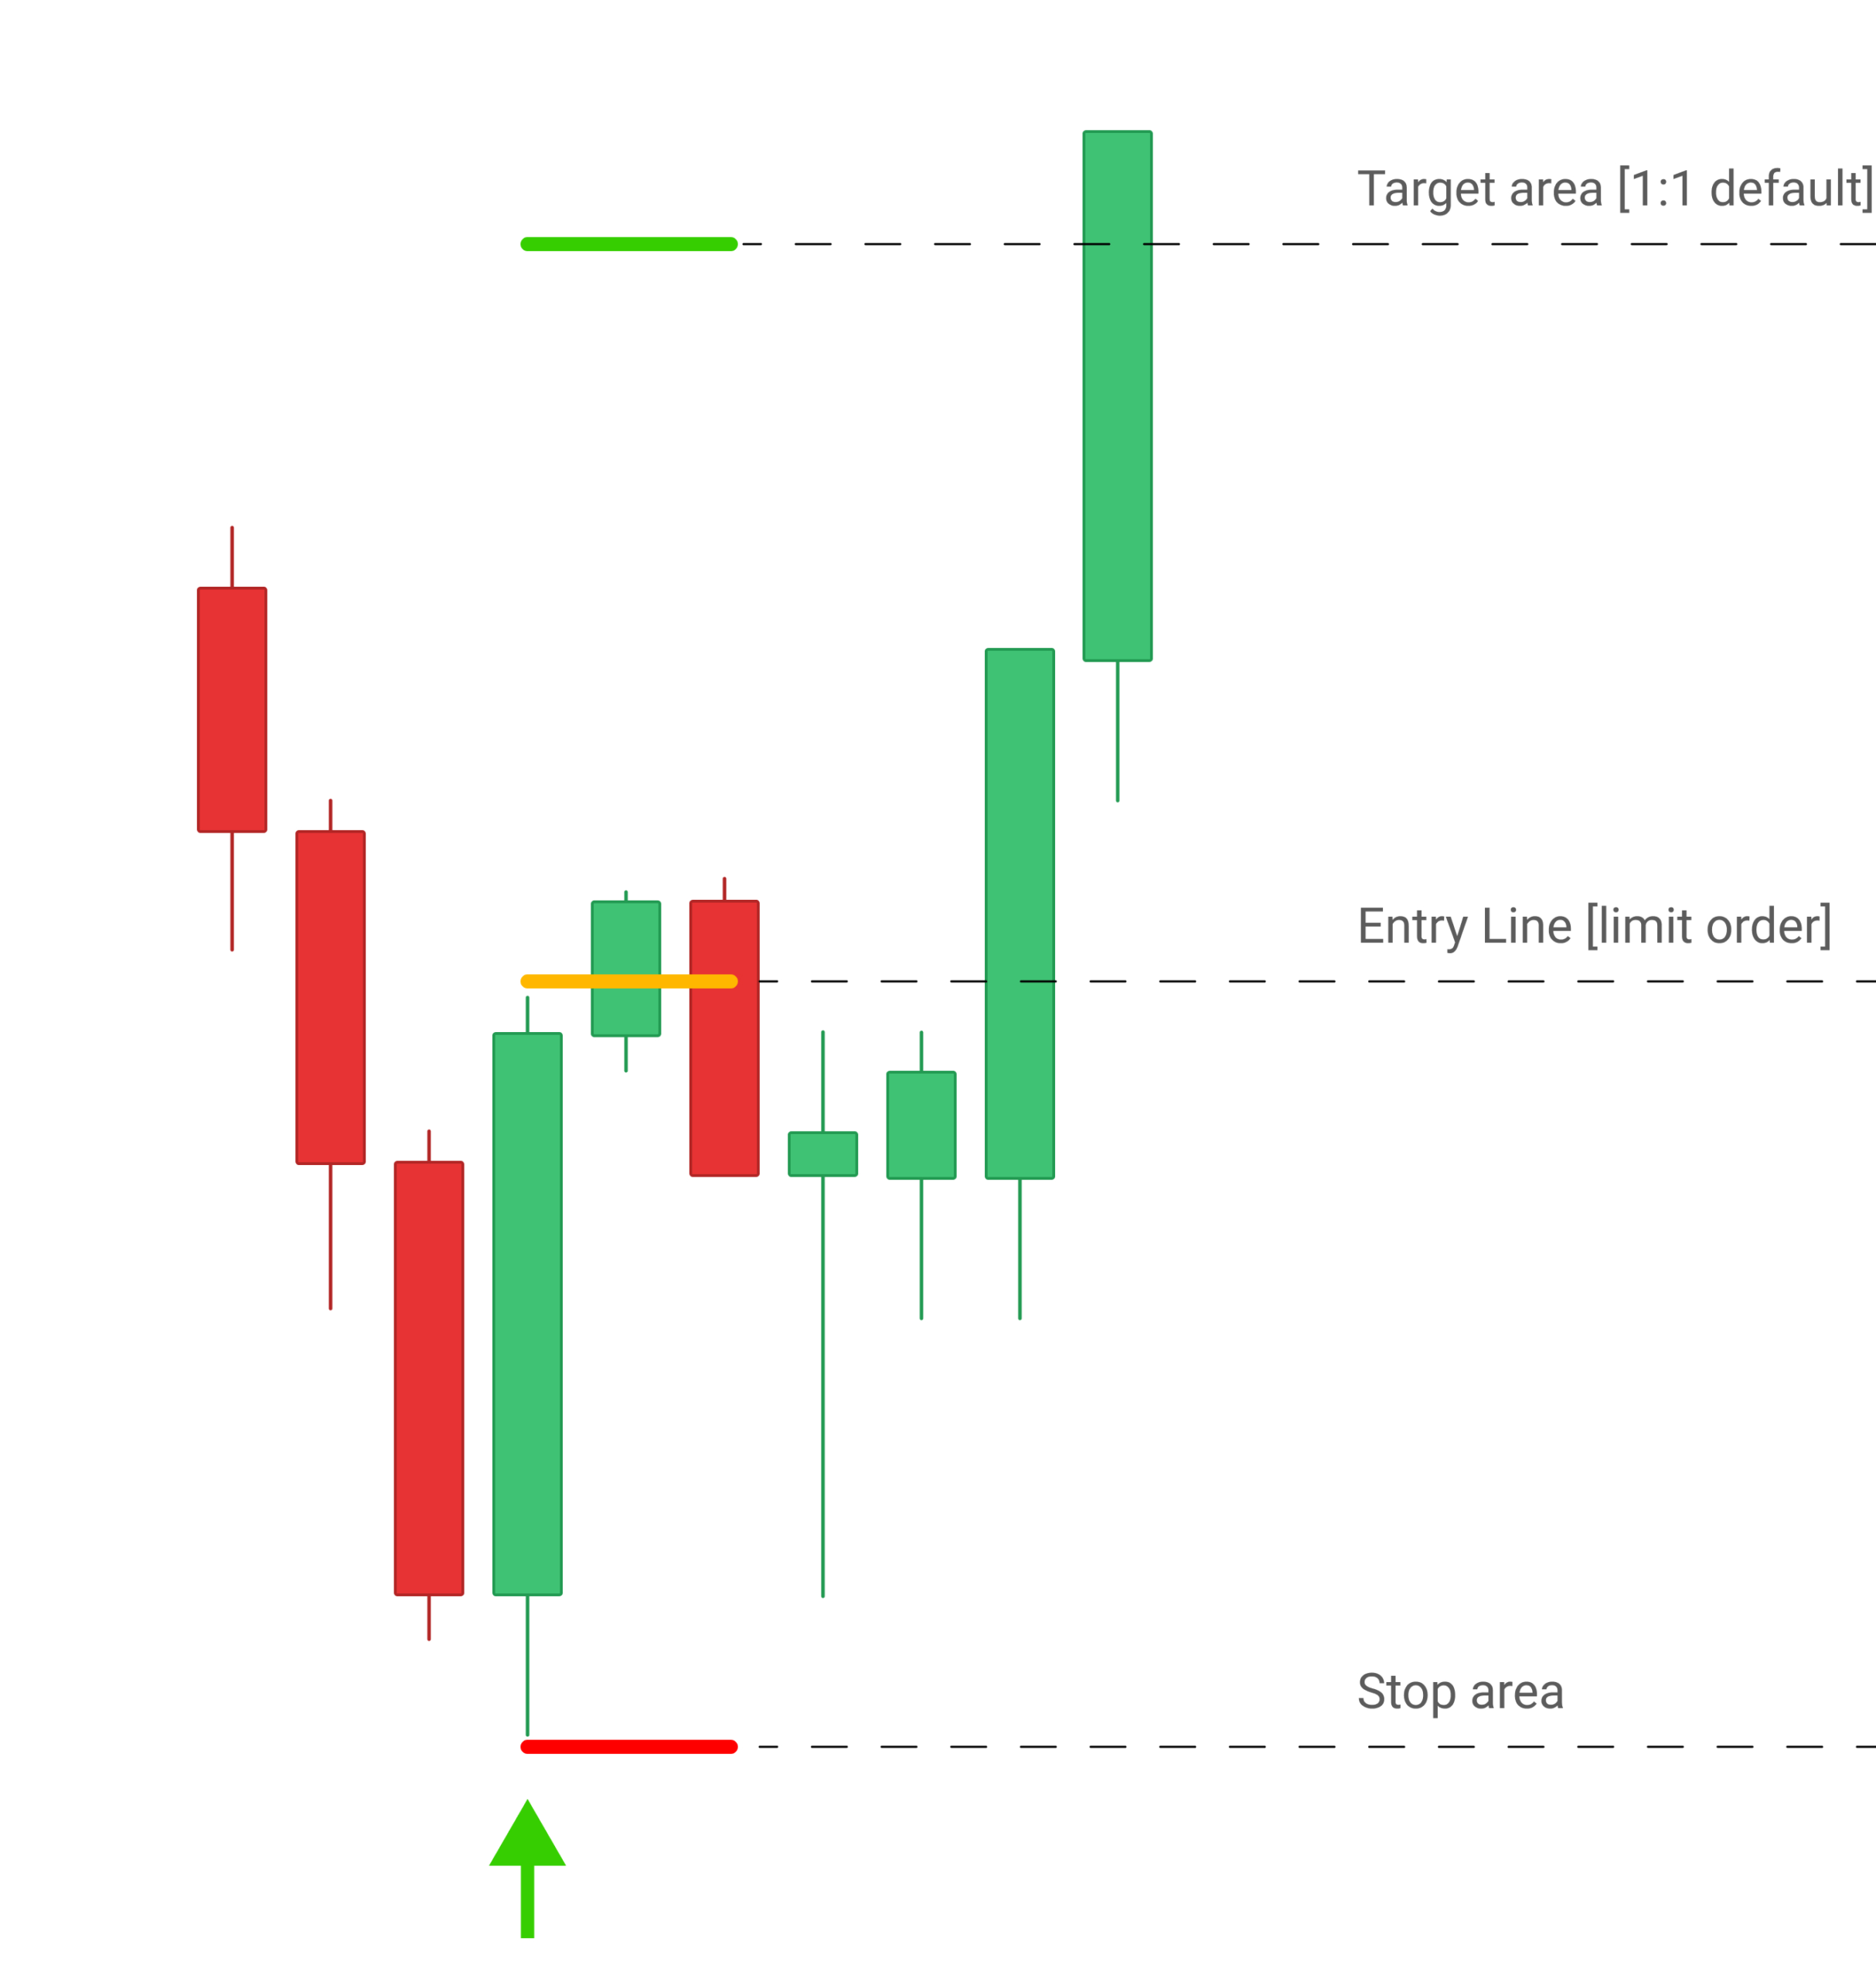
- Once a signal appears: set a limit entry order at the signal entry level in the direction of the signal.
- Avoid chasing the market: be patient and wait for a retracement if necessary.
- Cancel your order: if the price reaches the target without filling your entry, wait for the next signal.
Familiarize yourself with the key principles of the Reversal Indicator: including risk/reward settings, signal reliability, trade direction, sequential signals, and maximizing targets.
Consider important factors: such as trend direction, market stage, timeframe hierarchy, and key support/resistant levels when using the indicator.
Long Entry Signal Example
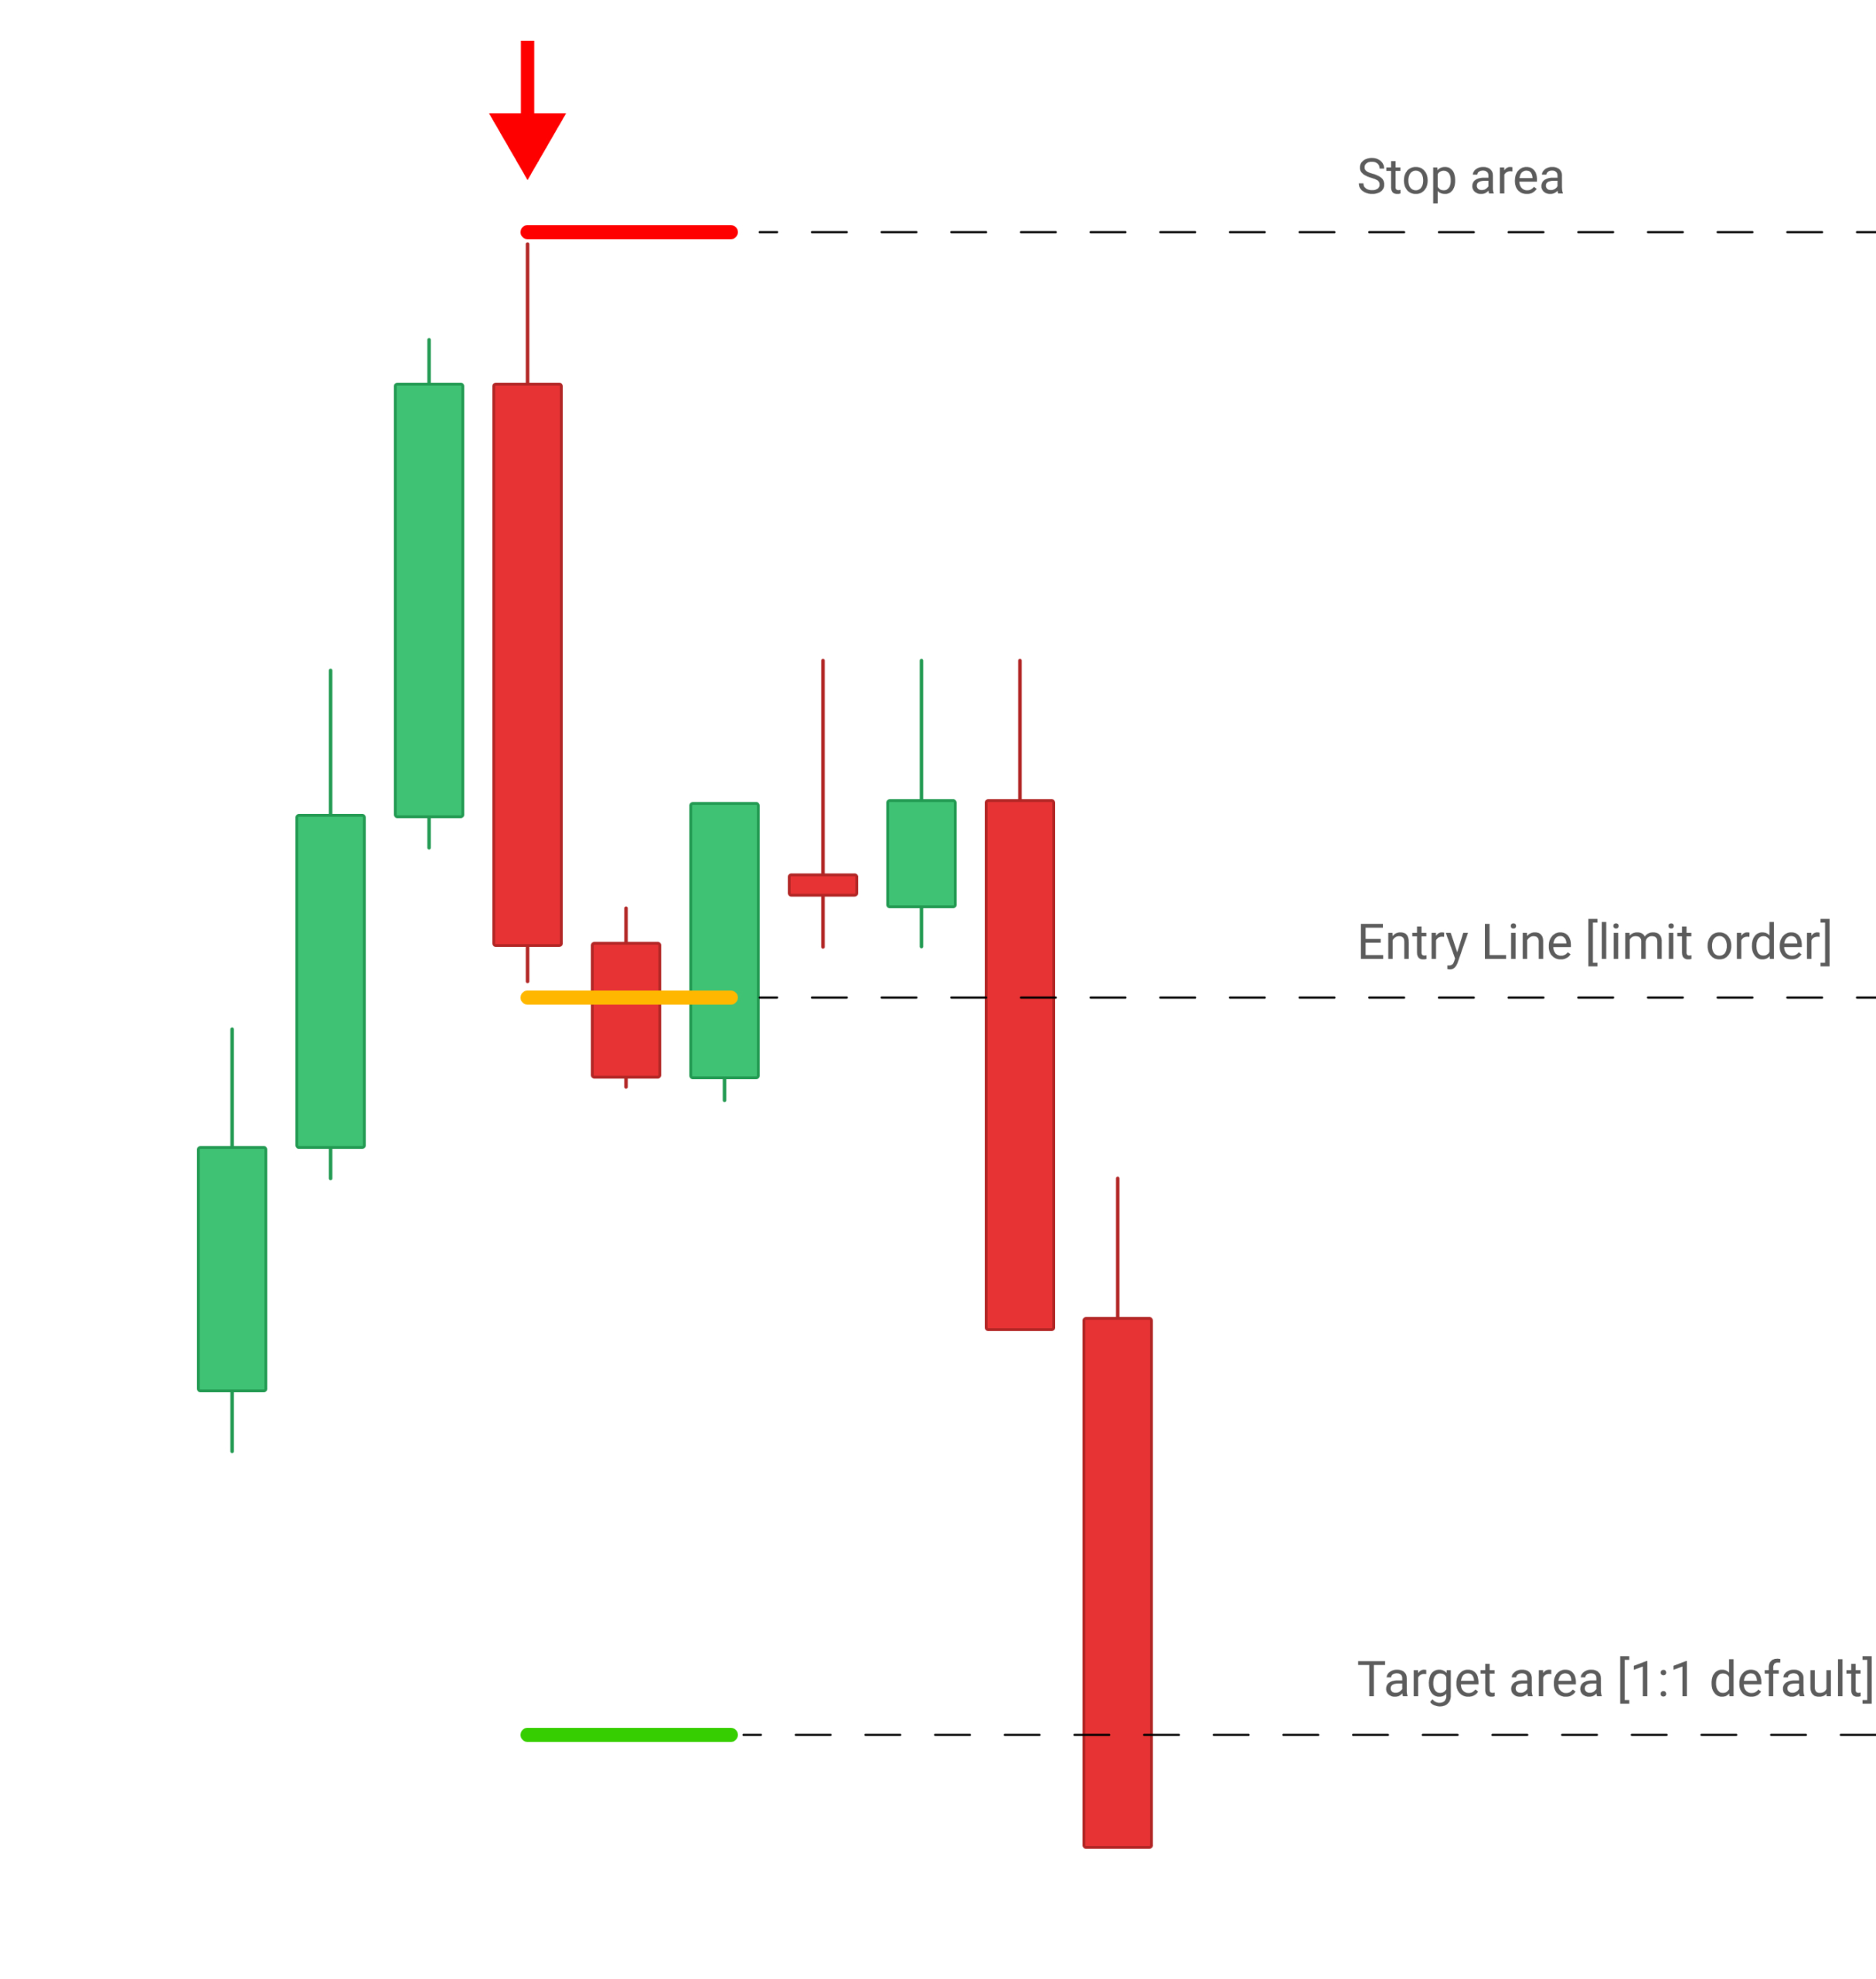
Short Entry Signal Example
3.3 Understanding Signal Workflow 🔗
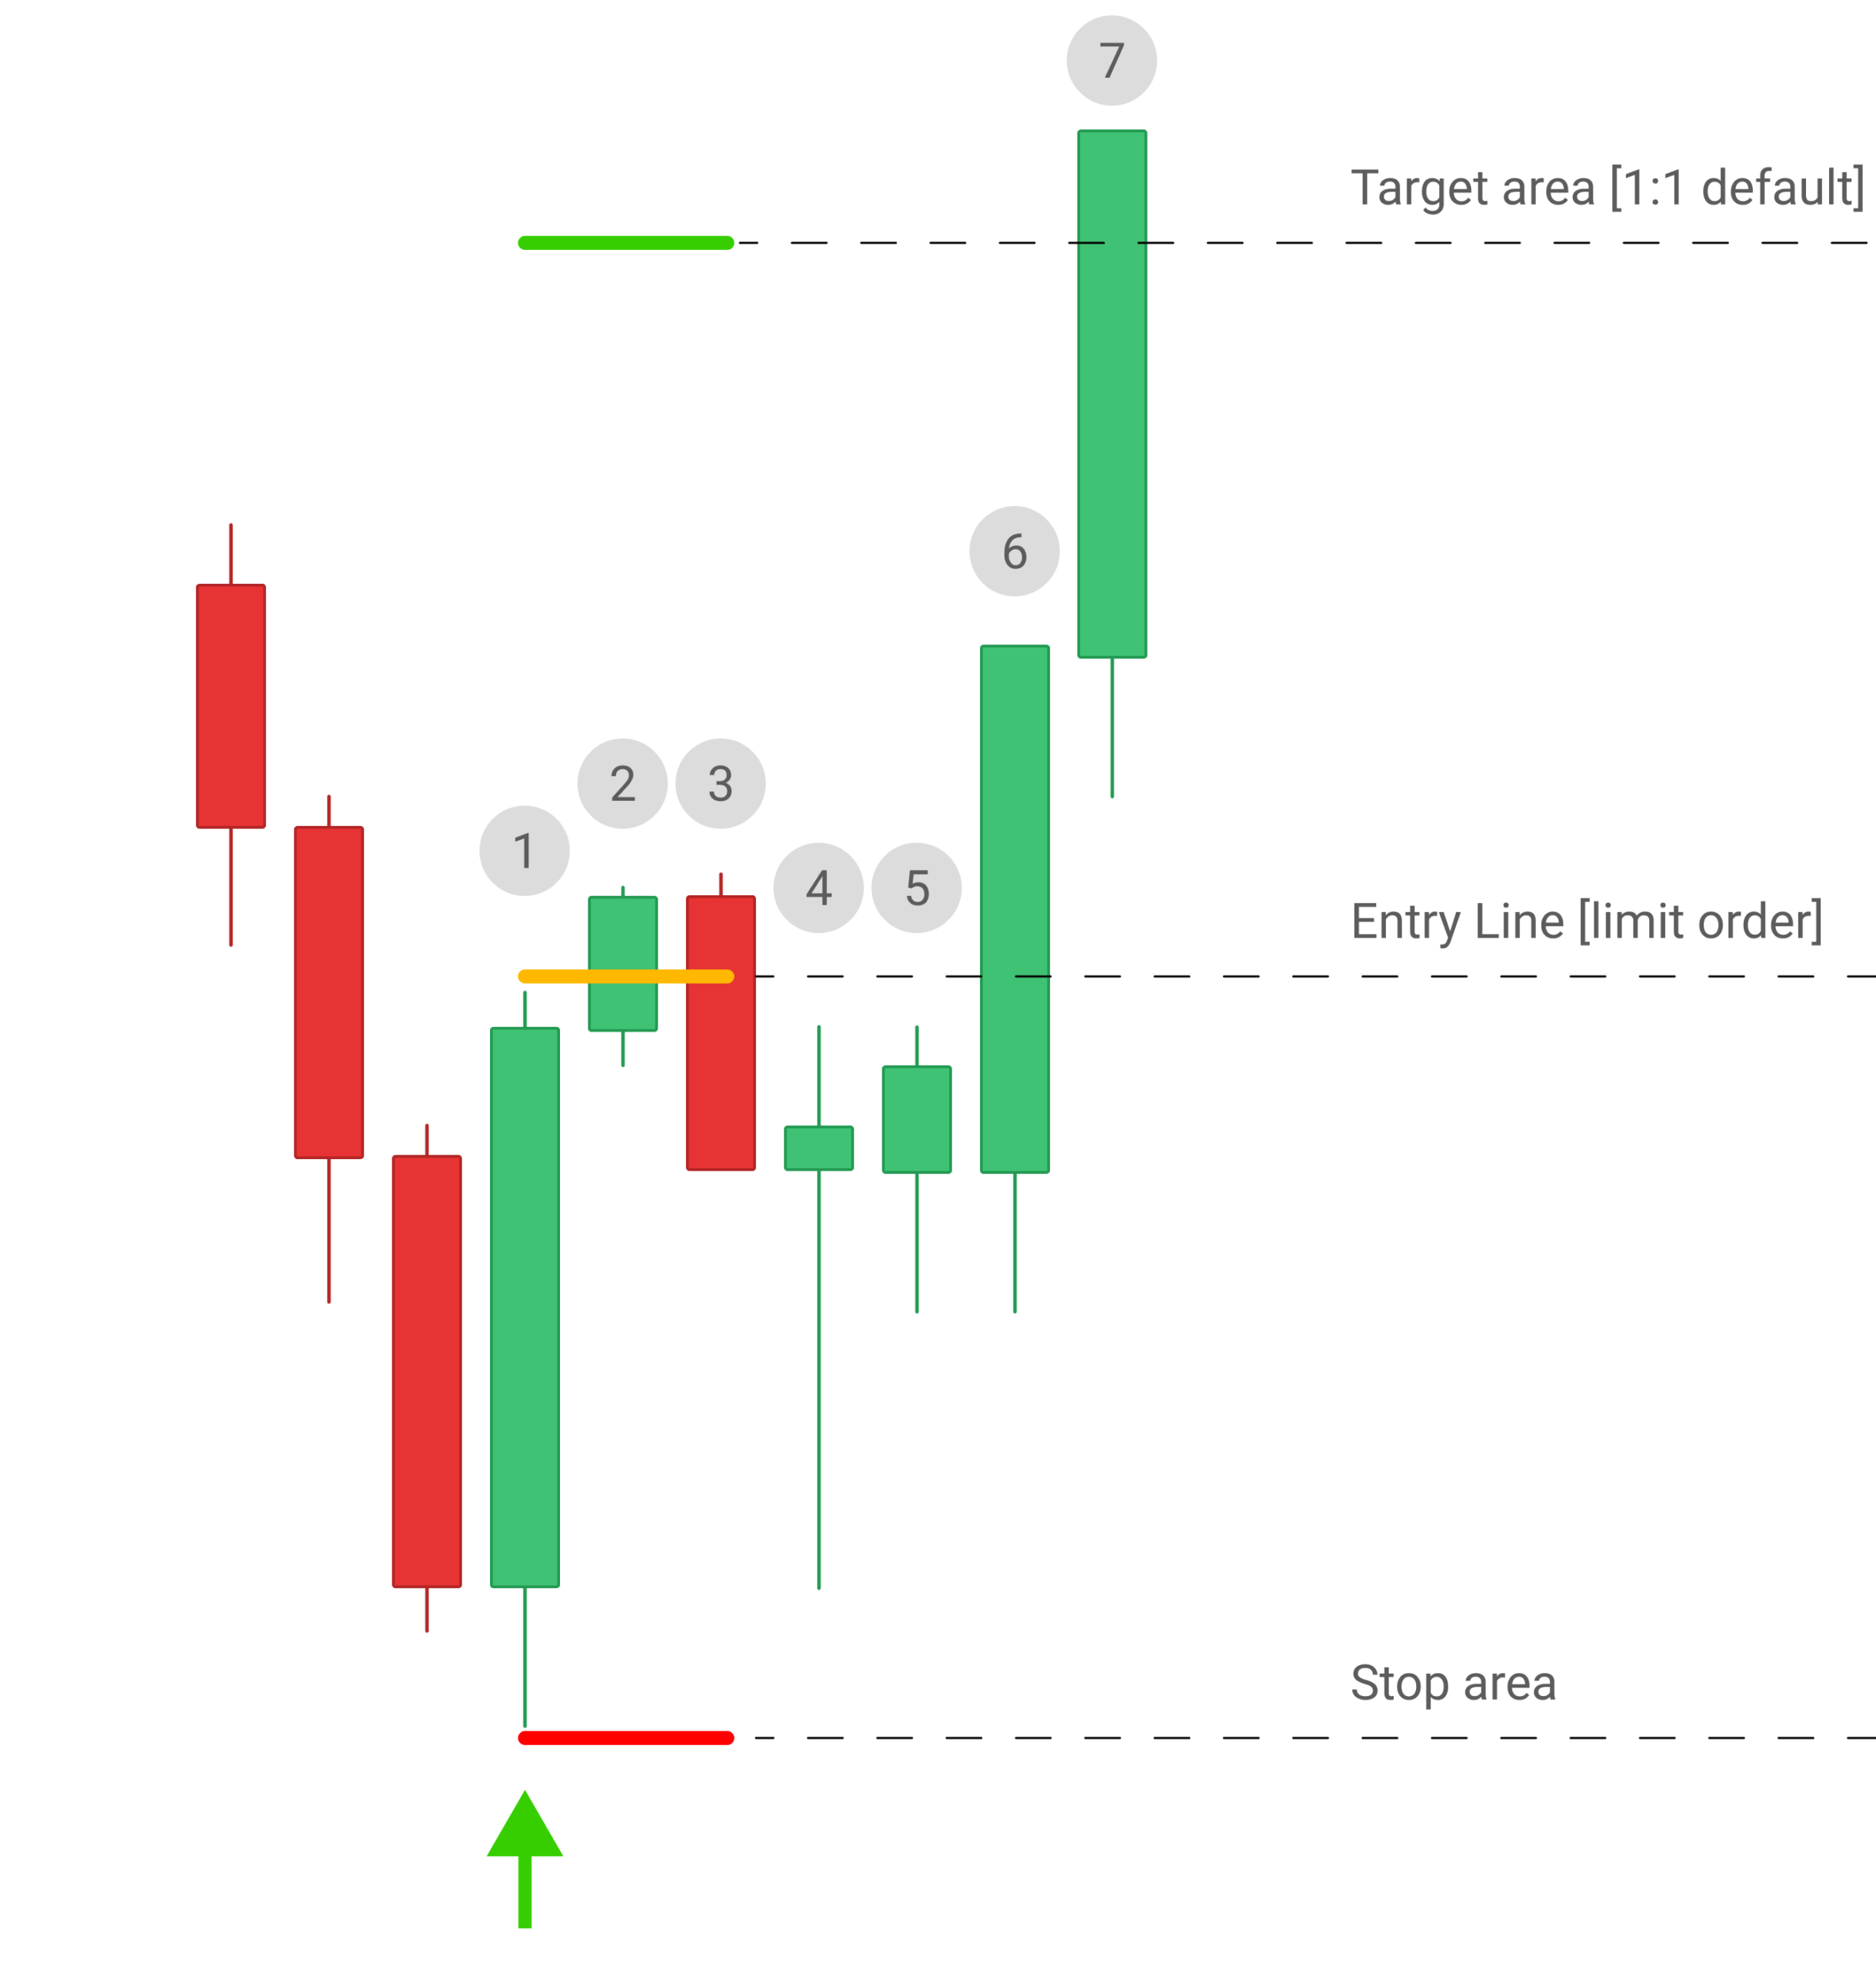
To understand when we’ll be filled by the market, we’ve included an illustrative example with candle enumeration. Let’s examine bar-by-bar when our action is required and how we’ll enter the market in this scenario.
- Candle #1 Finished: Indicator determines whether a bar satisfies all conditions necessary to display the signal.
- Candle #2 Finished: If conditions are met, the indicator plots the entry signal. Place your limit order on the yellow line in the direction of the arrow. (
Green Arrow = Limit Order Long) - Candle #3: The
long entry limit orderis filled during a pullback. - Candle #4–6: Market pull-back stage – we are in position waiting for the trade to finish.
- Candle #7: Market reached the
target area, green line (1:1).
3.4 Additional Insights and Tips 🔗
- Experiment with different timeframes for analysis and entry to find what works best for your trading style.
- Consider combining the Reversal Indicator with other technical analysis tools for confirmation.
- Practice proper risk management and always consider the overall market direction before entering a trade.
- Stay disciplined and stick to your trading plan when using the Reversal Indicator.
4. Indicator Parameters & Configuration 🔗
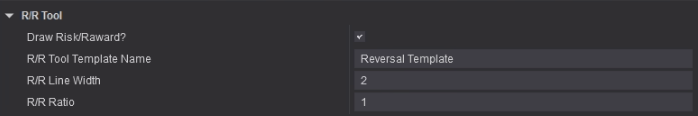
4.1 “R/R Tool” Configuration Tab 🔗
| Parameter: | Default Value | Description |
|---|---|---|
| R/R Tool Template Name | Reversal Template |
Provide the name of the Risk/Reward template you wish to use to show entry signals on the chart. |
| R/R Ratio | 1 |
You can adjust the risk/reward ratio of the signals by utilizing this parameter. |
4.2 How to change the style of the Risk/Reward signals? 🔗
- Double click on any R/R drawing on the chart.
- Change the style of the drawing to your liking.
- Save it by naming it however you prefer or use
Reversal Templatename to replace the default style. - Update the R/R Tool Template Name parameter with the
nameof the template you just created. - Refresh the chart by pressing F5.
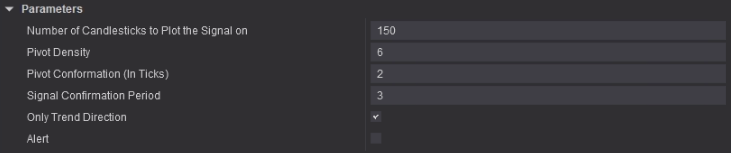
4.3 “Parameters” Configuration Tab 🔗
| Parameter: | Default Value | Description |
|---|---|---|
| Number of Candlesticks to Plot the Signal on | 150 |
This setting determines the number of historical candlesticks displayed on the chart to showcase the signal. Adjusting this value allows you to control how far back you can see all the signals. |
| Pivot Density | 6 (Bars) |
Pivot Density regulates the minimum required sequential bars behind to plot the pivot. Lower values result in more frequent signals, while higher values lead to fewer, but more significant reversal points being plotted. |
| Pivot Confirmation (in Ticks) | 2 |
This parameter specifies the number of ticks above the signal bar required to confirm the signal. It is generally recommended to keep this at default for optimal performance. |
| Signal Confirmation Period | 3 (Bars) |
Determines the number of candles the indicator can retain in memory to confirm the signal. A larger value provides more time and opportunities for the market to confirm the signal candles and plot the entry. |
| Only Trend Direction | True |
When enabled, this feature ensures that signals are plotted only in the direction of the prevailing trend, determined based on a moving average. |
| Alert | False |
Triggers an alert if a confirmation candle is identified. The alert is activated both before and after displaying the signal. If the alert is turned on but no signals are detected within the specified Signal Confirmation Period, it indicates that the signal wasn’t confirmed. |
5. Problem Solving 🔗
5.1 Indicator is not showing any signals? 🔗
If the indicator is not working, the first step is to verify if your license is currently active. You can do this by accessing the Log Tab in the NinjaTrader Control Center and checking for any errors associated with your license. If there are no errors or messages related to your machine ID, you can proceed to investigate the next potential reason.
5.2 Machine ID is active, but indicator is not showing any signals? 🔗
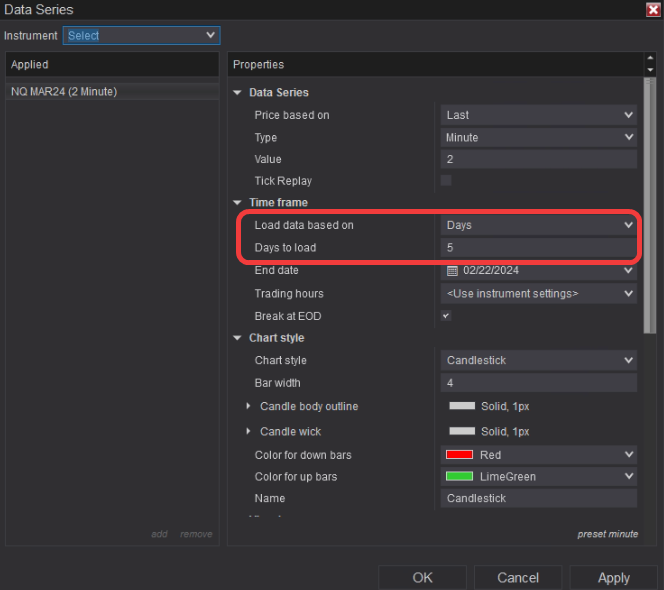
- Not enough data loaded on the chart: It can be that you have not enough data on the chart loaded in order for the indicator to print the signals. Make sure you have at least 5 days of data loaded.
- Unsupported Data Series: We have developed and tested our indicator on almost every timeframe using time-based candlesticks. However, we have not designed the Reversal Indicator to work with
renko,range, and other less widely used data series types. Please ensure that you are using time-based charts when utilizing our indicator.
6. Additional Insights 🔗
7. General Questions (FAQ) 🔗
7.1 Which timeframe suits this indicator the most? 🔗
Reversal Indicator functions effectively across all timeframes without exception. The only variation lies in the level of risk per trade needed, and the time available for executing the entry (limit order).
Using the Reversal Indicator on a 2-minute chart may present more complexity compared to a 5-minute chart, as there is less time to act upon signal placement. However, the risk per trade is evidently smaller on the 2-minute chart compared to others.
7.2 Is it possible to apply the indicator to custom candle types (non-minute)? 🔗
We haven’t tailored the Reversal Indicator to operate with non-time-based standard candlesticks. However, you can experiment to determine if the indicator operates effectively for your chosen data series. Feel free to explore its functionality and suitability for your specific needs. We have plenty of success stories from our customers who have adapted the indicator to custom data series types.
7.3 How to change style of the R/R drawing on the chart? 🔗
You can find instructions on altering the R/R drawing style on the chart in this part of our guide.
7.4 1:1 Hit immediately after signal placement, what should I do? 🔗
If the market rapidly reaches the 1:1 area right after the signal is plotted, simply disregard this signal and await another. Avoid attempting to enter this trade, as it has already occurred.
If you have placed a limit order for an entry anticipating a pullback, close it once the price reaches the 1:1 area, even if you haven’t entered the trade.
7.5 My signals have delay! 🔗
The entry signal is designed to establish with a slight delay. This delay is intentional, providing an additional layer of confirmation. Our goal with the Reversal Indicator is to act once the signal becomes visible and then enter on a pullback.
8. Conclusion & Next Steps 🔗
The Reversal Indicator for NinjaTrader 8 provides traders with precise entry signals, risk/reward visualization, and clear workflow rules to manage trades effectively. By following the installation steps, setup process, and parameter configuration described above, you can integrate it into your trading routine with confidence.
Always test on a simulation account before applying the indicator to live trading. This ensures that you fully understand its behavior across different timeframes and markets. For licensing or technical support, contact us directly at [email protected].