Trade Analyzer combines chart-based journaling with automatic performance analytics, turning every idea you draw into measurable trading data. This guide walks you through installation, workflow, parameter settings, web-report interpretation, and troubleshooting — everything you need to master the indicator.
Whether you trade discretionary setups or run automated templates, Trade Analyzer helps verify consistency through data-driven feedback. Each trade you sketch on the chart becomes a structured entry in your CSV export, ready for review in the companion web dashboard.
Table of Contents 🔗
- Introduction
- 1) Installation & Activation
- 2) How Trade Analyzer Works
- 3) Indicator Parameters Explained
- 4) Understanding the Web Report Metrics
- 5) Troubleshooting & Best Practices
- FAQ
1) Installation & Activation 🔗
Installing Trade Analyzer is simple and takes only a few minutes. You’ll import the .zip file into NinjaTrader 8, confirm the prompts, and restart the platform so the new indicator loads correctly.
- Download: Get the Trade Analyzer
.zipfile from your MAS Capital account or support email. Do not unzip it. - Import to NT8: In Control Center →
Tools > Import > NinjaScript Add-On...→ select the downloaded file. - Confirm prompts: If NinjaTrader asks to replace existing files, click Yes to All so your templates and logic stay in sync.
- Restart NinjaTrader: After import completes, restart the platform to compile the new indicator.
- Add to a chart: Open any chart →
Indicators (Ctrl + I)→ select Trade Analyzer PRO → OK.
Activation & Licensing (If Required) 🔗
Trade Analyzer is a licensed indicator distributed through the NinjaTrader vendor system. If your copy requires activation, send your Machine ID to our support team:
To: [email protected]
Subject: Trade Analyzer Activation

Hi MAS Capital Team,
Requesting activation for Trade Analyzer (NT8).
Machine ID: <YOUR NT8 MACHINE ID>.
Find your Machine ID under Control Center > Help > About → right-click → Copy Machine ID.
2) How Trade Analyzer Works 🔗
Trade Analyzer is built around three simple actions: draw trades on chart, export to CSV, and review in the web report. Each part of the workflow is designed to keep your testing, journaling, and analysis effortless and visual.
Drawing Trades on Chart 🔗
Once Trade Analyzer is added to a chart, you can plot trades directly with a quick mouse and keyboard combo. Each trade ruler includes an entry, stop, and up to four reward targets (1R–999R).
- Hold your configured R/R Key Combination (e.g. Ctrl + Middle Click or only Middle Click by default) and click on the chart to create a new ruler.
- The first click sets the entry and the second defines the stop.
- Trade Analyzer instantly projects all reward targets, calculates risk, and labels each R level in ticks, points, or currency (based on your settings).
- Click a ruler again to remove it — no need to open any menus.
Exporting Data to CSV 🔗
Every trade you draw is automatically tracked. As historical bars load or replay runs, Trade Analyzer records whether each setup hit a target or stop and when it happened.
- When finished reviewing or replaying, click the Report button on the chart panel.
- The indicator exports all trade data to a
.csvfile located inDocuments → NinjaTrader 8 → TradeAnalyzerReports. - Each record includes trade direction, entry/stop prices, R-multiple, tick/point distance, hit timestamps, and USD result.
Loading the Web Report 🔗
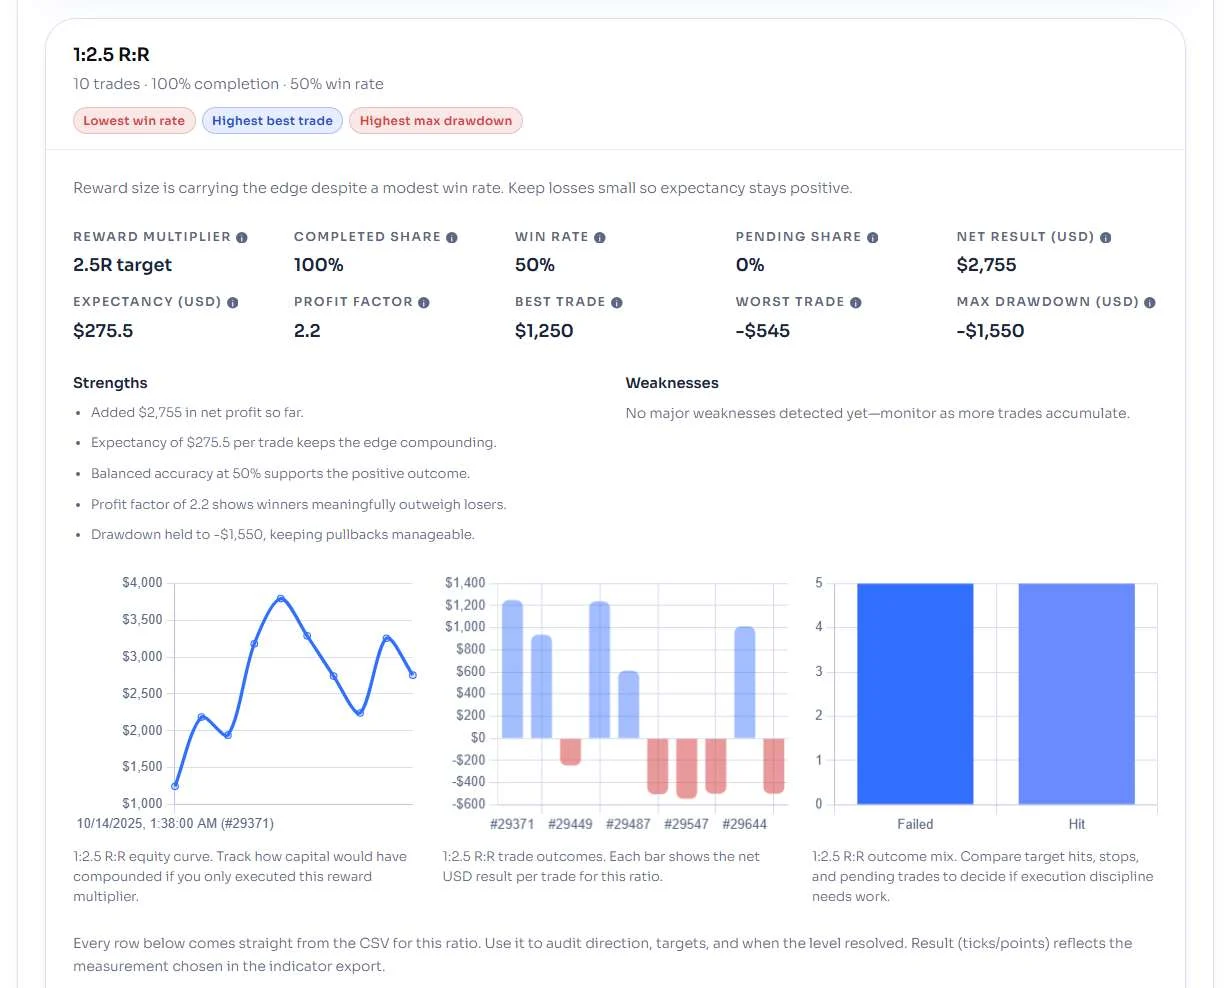
The companion Trade Analyzer Web Report turns raw CSV data into a structured performance dashboard. It provides summary cards, expectancy calculations, equity curves, and comparison tables across all tested R-multipliers.
- Visit the Trade Analyzer Web Report link.
- Drag your exported
.csvfile into the browser window. - The dashboard will load automatically — no installation or login required.
- View overall results and per-R multiple panels.
- Compare win rate, expectancy, and profit factor across each reward level.
- Hover over metrics for quick definitions and visual highlights of strengths and weaknesses.
3) Indicator Parameters Explained 🔗
Trade Analyzer offers full control over behavior, appearance, and calculation style. These settings determine how trades are drawn, how they look on the chart, and what data is logged to your report.
General Controls 🔗
- R/R Key Combination — defines your shortcut for placing trades (e.g., Ctrl + Middle Click). Choose the combo that feels natural to your workflow.
- First Click Sets Entry — when enabled, your first click anchors the entry price and the second sets the stop. Disable it to reverse the order.
- Display Mode — choose between Ticks, Points, or Currency for on-chart labels.
- Convert Ticks to Points — automatically translates tick values into points for easier readability (useful for ES, NQ, GC, etc.).
- Amount of Contracts — defines how many contracts each ruler assumes when calculating USD results.
- Draw Behind Bars — toggles whether lines and shaded zones appear behind or over candles.
Styling Options 🔗
- Entry/Stop Width — controls the line thickness for entries and stops.
- Target Line Width — adjusts how thick your reward lines appear (1 = thin, 3 = bold).
- Ruler Width — defines how many bars the ruler spans across the chart before fading.
- Show Rectangle — enables or disables shaded profit/loss areas behind the trade.
- Background Opacity — sets how transparent the shaded zones appear (0.2–0.8 recommended).
- Overall Line Opacity — controls the transparency of all ruler lines for visual balance.
Target Ladder 🔗
- Show Target #1–#4 — toggles visibility for each R multiple (1R to 5R by default).
- R Multiple #1–#4 — defines the distance of each target relative to your stop.
Typical ladder example:
| Target | Multiplier | Purpose |
|---|---|---|
| R1 | 1.0 | Quick scalps / 1:1 setups |
| R2 | 2.0 | Core trade target |
| R3 | 3.0 | Runner capture |
| R4 | 5.0 | Swing or trend continuation |
Color Palette 🔗
- Text Brush — label color for entries, stops, and targets.
- Stop Brush — defines the stop line and risk zone color (red recommended).
- Entry Brush — sets the entry line color (blue or cyan for clarity).
- Target Brushes (R1–R4) — colors for each reward line; use distinct tones for faster visual separation (e.g., green, teal, purple, gold).
4) Understanding the Web Report Metrics 🔗
The Trade Analyzer web report transforms your exported CSV into a structured dashboard of performance metrics. Every number helps you evaluate how each reward-to-risk setup behaves across trades, revealing where consistency and expectancy truly lie.
Panel Metrics 🔗
Each panel in the report represents one reward multiple (1R, 2R, 3R, etc.). Use these metrics to read your results at a glance:
- Reward multiple — the ratio of reward to risk (e.g., 1:2 means risking $1 to make $2).
- Completed share — percentage of trades that have finished (hit stop or target).
- Win rate — share of completed trades that ended profitable.
- Pending share — open trades still waiting for an outcome.
- Net result (USD) — total profit or loss for that R multiple.
- Expectancy (USD) — average gain or loss per trade, including wins and losses.
- Profit factor — ratio of total wins to total losses; above 1.0 means positive edge.
- Best trade — largest single profit.
- Worst trade — largest single loss (negative).
- Max drawdown (USD) — deepest decline from peak to trough on the equity curve.
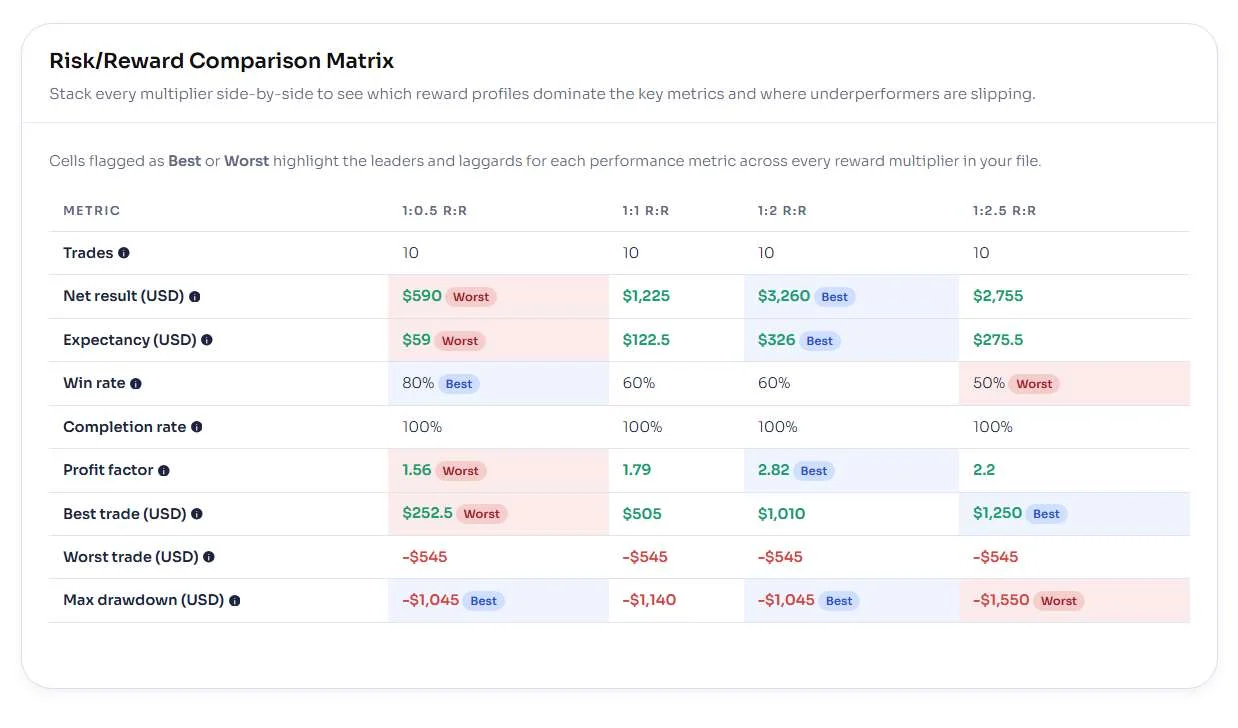
Highlights & Comparison Matrix 🔗
Below the panels, the report highlights the best and worst performers across all reward levels. The comparison matrix makes it easy to see where your edge is strongest and where it needs improvement.
- Top / Lowest Net Performer — identifies which reward ratio produced the highest or lowest total profit.
- Highest / Lowest Profit Factor — shows how efficiently each R multiple converts risk into reward.
- Highest / Lowest Win Rate — which ratio wins most often.
- Highest / Lowest Expectancy — reveals the most reliable average return per trade.
- Highest Best Trade — the biggest single winner across all ladders.
- Lowest Worst Trade — smallest single loss (a sign of good control).
- Highest Worst Trade — largest single loss; use this to check risk boundaries.
- Lowest / Highest Max Drawdown — how stable or volatile each equity curve feels.
5) Troubleshooting & Best Practices 🔗
Trade Analyzer is designed for reliability, but a few small configuration issues can cause missing drawings, empty reports, or data mismatches. Use this checklist to quickly identify and resolve the most common problems.
Common Setup Issues 🔗
- No drawings appear? Verify you’re holding the correct R/R Key Combination when clicking on the chart. If in doubt, open
Indicators → Trade Analyzer → Parametersand re-assign a fresh shortcut. - Nothing exported to CSV? Ensure you’ve drawn at least one trade ruler, and let enough bars pass for a stop or target to trigger. Only completed trades are logged.
- “Indicator not found” after update? Restart NinjaTrader 8 to recompile all assemblies. Imports without restarts often cause missing references.
- Web report not loading? Check that your CSV file isn’t renamed or edited. The header row must remain unchanged. Re-export directly from the indicator if unsure.
- All trades show pending? The indicator only finalizes outcomes when price revisits stop or target zones. Run Replay or allow live data to complete each setup.
Performance & Workflow Tips 🔗
- Keep one ruler per idea — multiple overlapping rulers can clutter results and slow rendering.
- Adjust Ruler Width for your timeframe. Short-term charts work best around
50 bars; higher timeframes may need5-10. - For testing, use Replay mode to accelerate result collection and confirm consistency of target hits.
- Back up CSV exports weekly; tracking cumulative performance helps refine your system over time.
- Match Display Mode (ticks, points, or USD) with your preferred analysis unit before exporting.
- Combine with Advanced Trader for deeper scenario mapping.
FAQ 🔗
Does Trade Analyzer work in both live and Replay mode?
Yes. You can use it on live charts or NinjaTrader’s Replay feature. During Replay, it automatically records completed trades once a target or stop is hit.
Where are my exported CSV files saved?
All exports are stored inside your Windows Documents folder under Documents → NinjaTrader 8 → TradeAnalyzerReports. Each file is timestamped for easy tracking.
Why is my web report empty or showing zero trades?
Make sure the CSV file includes completed trades. The indicator logs only setups that have either hit a target or stop. Also confirm that you haven’t edited or renamed the CSV columns.
Do I need a license or Machine ID activation?
Yes, Trade Analyzer uses the NinjaTrader vendor system for licensing. Email your Machine ID to [email protected] to activate or transfer a license.
Can I change the default key combination for drawing trades?
Yes. Open the indicator settings and modify R/R Key Combination to any mouse and keyboard combo you prefer (e.g., Ctrl + Middle Click).
Can I compare Trade Analyzer results with my automated strategies?
Absolutely. Many traders use Trade Analyzer to test manual setups before automating them with systems like M Trader or J Strategy.