Advanced Trader is a precision overlay for NinjaTrader 8 that shows your trade math in real time: risk/reward (R/R), distance in ticks/points, contract-aware $ values, and a clean position summary—all synced to your entry, stop, and targets.
This guide covers installation, setup, on-chart elements, every parameter tab, hotkeys vs SAVE R/R button, drawing conditions, aggregation logic, layout/performance notes, troubleshooting, and FAQs—plus quick demo videos along the way.
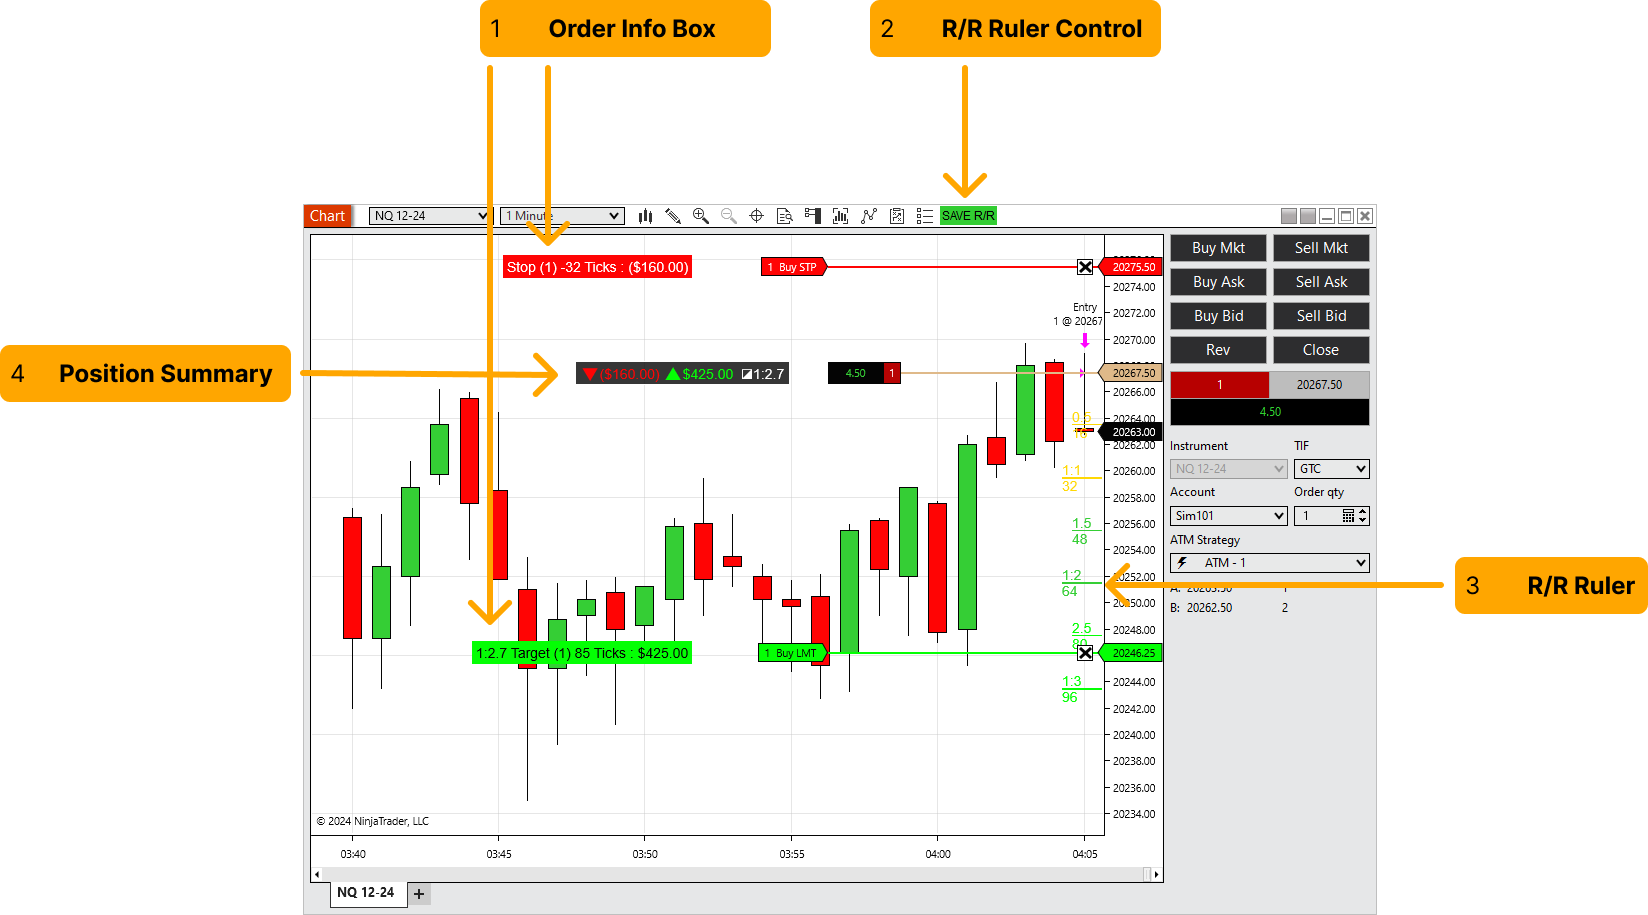
Table of Contents 🔗
- Introduction
- 1) Installation (Import NinjaScript)
- 2) Setup on a Chart & ATM Selection
- 3) Understanding the On-Chart Elements
- 4) Indicator Parameters & Configuration
- 5) SAVE R/R Button & Hotkeys (PressToSave vs HoldToReset)
- 6) Display & Units (Ticks, Points, Currency)
- 7) R/R Levels, Colors & Styling
- 8) When It Draws (Requirements & Order Types)
- 9) Multi-Target Aggregation Logic
- 10) Chart Layout & Performance Notes
- 11) Troubleshooting
- 12) FAQ
- 13) Resources & Support
Introduction 🔗
Full information about your orders—at a glance. Advanced Trader calculates and displays potential P/L in ticks/points and currency, live R/R at current stop/targets, and a compact position summary that updates as you move orders.
It’s ideal for day traders who want consistent sizing, faster decisions, and zero guesswork around the real-time math of each trade—whether you use an ATM Strategy or manual exit orders.
1) Installation (Import NinjaScript) 🔗
- Download the Advanced Trader
.zipfile and keep it handy. - In Control Center go to
Tools > Import > NinjaScript Add-On...and select the file. - Approve any prompts to replace existing components.
- Restart NinjaTrader 8 to load the latest code.
2) Setup on a Chart & ATM Selection 🔗
- Open a chart → right-click → Indicators… → choose Advanced Trader under MASCAPITALUK → OK.
- (Optional) In Chart Trader, select your Account, Quantity and an ATM Strategy.
- Enter a trade (long/short) to see the Order Info Box, R/R Ruler, and Position Summary.
3) Understanding the On-Chart Elements 🔗
3.1 Order Info Box 🔗
Summarizes the order you’re interacting with:
- R/R ratio to target(s)
- Order name and contracts
- Distance from entry in ticks/points
- $ value if the order is triggered
3.2 R/R Ruler Control 🔗
A chart button (or hotkey) that saves the current stop position and locks the R/R lines. As you move your stop, the dynamic ruler updates in real time; click Save (or use hotkey) to freeze the lines for review.
3.3 R/R Ruler 🔗
A live ruler projecting risk and reward multiples from your entry/stop. Levels can be customized (e.g., 1:1, 1:2, 1:3… 1:10) and color-coded for clarity.
3.4 Position Summary 🔗
- 🔻 Stop total ($) with current placement
- 🔺 Target total ($) across all working targets
- ◪ 1:R overall R/R for the position
4) Indicator Parameters & Configuration 🔗
4.1 “General” Tab 🔗
| Parameter | Default | Description |
|---|---|---|
| Font | Arial, 14px | Text for labels and boxes. |
| Info Box Display | All | Ticks (distances) / Currency ($ values) / All (both) |
| Order Info Box Distance | 190 | Pixel offset from order lines. |
| Convert to Points | false | Show distances as points instead of ticks. |
| Show R/R Ratio | true | Toggle R/R display. |
4.2 “Info Box Colors” Tab 🔗
Customize fonts and colors for the Order Info Box for maximum visibility on your chart theme.
4.3 “Position Summary Box” Tab 🔗
| Parameter | Default | Description |
|---|---|---|
| Show Position Summary? | true | Enable/disable the summary box. |
| Summary Display Position | Entry Line | Entry Line, Top/Bottom Left, Top/Bottom Right. |
| Order Info Box Distance | 100 | Offset when using Entry Line placement. |
4.4 “Risk/Reward Ruler” Tab 🔗
- Show Text — labels on/off
- Show R/R Ticks — show distances in ticks
- Show Fractional Levels (#1, #3, #5) — toggle intermediate levels
4.5 “Risk/Reward Ruler Levels” Tab 🔗
Enable predefined ratios (1:1, 1:2, 1:3… 1:10), set custom levels, and assign colors for visual grouping.
4.6 “Ruler Controls” Tab 🔗
| Parameter | Default | Description |
|---|---|---|
| Stop Save Method | Chart Button | Chart Button (on-chart “SAVE R/R”) or Hotkey. |
| Stop Save Hotkey | F4 | Used when Hotkey method is selected. |
| Hotkey behavior | PressToSave | PressToSave = save once; Hold to Reset = hold ~2s to reset. |
4.7 “Ruler Style” Tab 🔗
Adjust the ruler’s width and length to match your chart’s scale and spacing.
5) SAVE R/R Button & Hotkeys (PressToSave vs HoldToReset) 🔗
Choose how you save the stop anchor for the R/R ruler:
- Chart Button: a green SAVE R/R button appears on the active chart tab. Click to save/lock lines at the current stop.
- Hotkey: pick from F2, F3, F4, F6–F12. Two behaviors:
- PressToSave: tap once to save (locks lines).
- HoldToReset: press and hold to temporarily clear the saved state; release to re-save at the new stop/entry.
6) Display & Units (Ticks, Points, Currency) 🔗
- Info Box Display: Ticks, Currency, or All (both).
- Convert Ticks to Points: on = points; off = ticks.
- Currency format: follows your Windows/NinjaTrader UI culture (e.g., $, €, £).
7) R/R Levels, Colors & Styling 🔗
Configure exact ratios, line sizes for whole vs fractional levels, and color groups for instant visual parsing.
- Default levels: 0.5R, 1R, 1.5R, 2R, 2.5R, 3R (fully customizable; you can keep just 1R & 10R if preferred).
- Whole vs fractional sizes: separate width/length controls for whole (1/2/3R) and fractional (0.5/1.5/2.5R).
- Labels: toggle text (“1:2”) and/or tick counts per level.
- Colors: three independent brushes for level groups (e.g., 1R/2R/3R vs fractional sets).
8) When It Draws (Requirements & Order Types) 🔗
- Requires: a non-flat position on the chart’s selected account (and instrument), with Chart Trader active (visible or hidden).
- Orders used: working/accepted stops (Stop Market/Stop Limit/Sim Stop) and targets (Limit, MIT supported).
- Scale-ins are ignored by design for R/R projection.
- No pre-entry ruler: R/R is computed from live position + stop.
9) Multi-Target Aggregation Logic 🔗
Targets/stops at the same price & order type are combined into a single info line with the aggregated contracts. This keeps the chart readable while preserving accurate P/L math.
10) Chart Layout & Performance Notes 🔗
- Spacing control: If info boxes feel tight, increase Chart Trader → Order Display Bar Length or adjust Order Info Box Distance / Entry Display Offset in the indicator.
- Performance: updates on price change and suspends when the window/tab isn’t active (resource-friendly).
11) Troubleshooting 🔗
- No boxes showing? Ensure you’re not Flat, and the Account in Chart Trader matches the open position.
- Hotkey does nothing? It may be bound elsewhere. Clear conflicts via
Tools > Hot Keys. - Boxes overlap? Increase Order Display Bar Length or raise Order Info Box Distance.
- Switched tabs and lost SAVE button? The toolbar button is tab-aware; return to the tab where Advanced Trader is active.
12) FAQ 🔗
Can I change colors?
Yes—use the Info Box Colors, R/R Levels, and other appearance settings to match your theme.
Can I restrict the R/R ruler to 1:1 and 1:10 only?
Yes—toggle off unnecessary levels in Risk/Reward Ruler Levels and keep only 1:1 and 1:10 (or any custom set).
Can I see the R/R ruler before entering a trade?
No. The ruler is based on a live position (entry + stop). Enter first, then the ruler calculates in real time.
Does it work with Chart Trader closed?
The indicator is linked to Chart Trader state. You may use Chart Trader (Hidden) to keep visuals clean while features remain active.
Can I use Advanced Trader without an ATM selected?
Yes. If you entered without an ATM, place a stop order above entry and a target order below (for longs; invert for shorts). The indicator detects these and computes values accordingly.
Does it work with multiple orders, targets, and stops?
Yes. It aggregates position data across multiple targets/stops to show total risk and potential P/L.
13) Resources & Support 🔗
- Product page: Advanced Trader — Ultimate Trading Tool
- Related: Free Indicators Pack (execution & risk helpers)
- Pro risk levels: R/R Indicator (Pro)
- Platform basics: NinjaTrader 8 Machine ID — find & manage
- 24/7 uptime: Virtual Servers for Trading
Need help activating or configuring? Email [email protected] and include screenshots of your chart and settings if possible.